Rising wedge
A rising wedge pattern usually happens within an uptrend — either a long-term or short-term one — when the pressure from the sellers starts to catch up to the buyers.
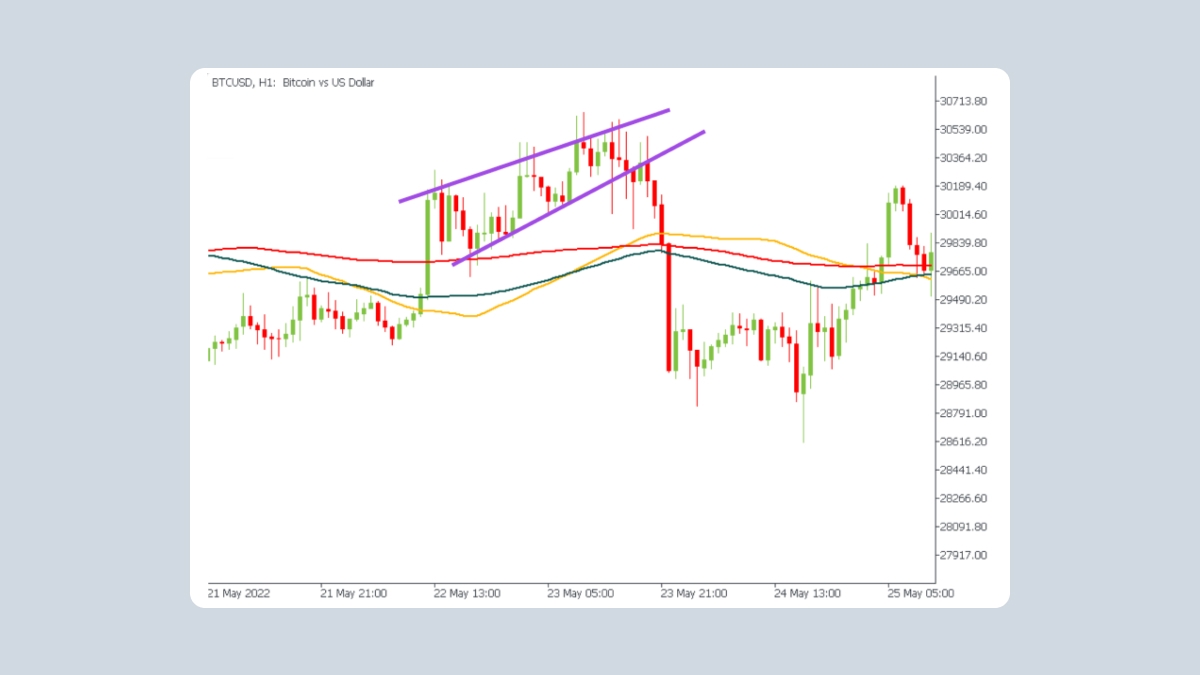
This is how a rising wedge looks on price charts. As you can see, at first the distance between the higher highs and the higher lows is noticeable. As the new prices form, the distance starts to shrink. The formation of new higher highs slows down while higher lows continue to appear at the same pace. The lines drawn along the higher highs and higher lows are getting closer and closer together and are about to converge, indicating the waning interest of the bulls, which doesn’t seem to be resisting the growing pressure from the bears.
Then, when the resistance and support lines get incredibly close together, the breakout occurs and the price makes a sharp downturn, breaching the support line. Unlike other chart patterns, a rising wedge happens quickly and the price drops dramatically, indicating that the bulls have given way under bearish pressure.
Falling wedge
A falling wedge pattern is another technical chart pattern that serves as a trend reversal or continuation signal. But, unlike a rising wedge, a falling wedge occurs at the bottom of a downtrend and indicates a potential rise in prices.
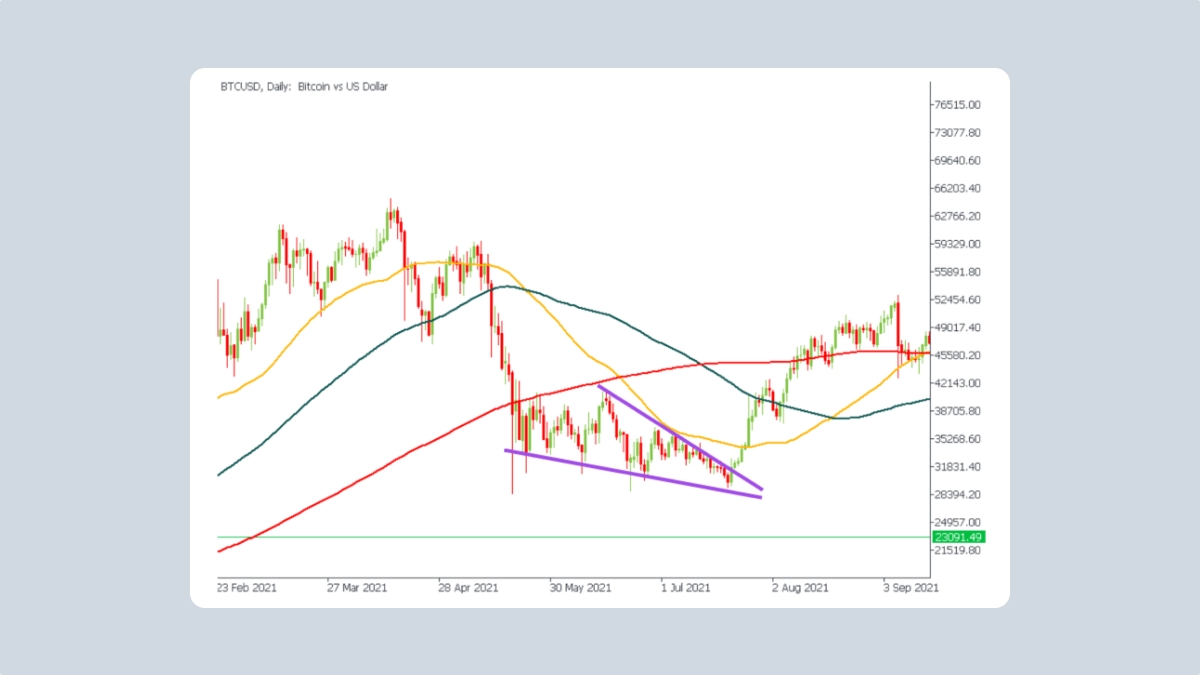
As you can see on this chart, a falling wedge typically appears at the bottom of a downtrend. The downtrend on the chart is slowing and the resistance of the bears seems weaker than the support of the bulls. The distance between the resistance and support lines is getting smaller, with the support line being the more stable of the two. Just when the trend is about to lose its momentum altogether and allow the resistance line to breach the support line, the price sharply turns up and continues to climb, starting a new uptrend. The bulls gather enough force to breach the bears’ resistance, reversing the downtrend for good.
A falling wedge can also occur during a steady uptrend as part of a very short-term price rebound. But in this case, it still serves as a bullish pattern and signals the continuation of the uptrend, unlike a rising wedge.
Is a rising wedge bullish or bvearish?
A rising wedge can happen during both an uptrend and a downtrend. In an uptrend, it comes before a downward reversal in price movement. In a downtrend, it usually comes at the end of a small period of upward consolidation. In both scenarios, the bulls are steadily yielding to the pressure from the bears; it signals a bearish reversal or continuation of the downtrend. So, a rising wedge is considered a bearish pattern.
How reliable are rising wedges?
When a rising wedge appears on a chart, it’s considered a sign of an imminent breakout to the downtrend. Professional technical traders also praise it as a reliable bearish pattern. Moreover, a rising wedge is closely followed by a breakout with a sharp price decline, so a lot of traders watch out for this pattern as a way of maximizing their profit within a short time.
There are quite a few false patterns that beginners may confuse with a rising wedge. To avoid this, you need to pay close attention to price/volume divergences. It’s also good to know that when a rising wedge pattern is genuine and valid, the price touches the support and resistance lines at least 3 times.
Bottom line
All in all, a rising wedge pattern is widely accepted as a very reliable and useful bearish reversal pattern. It’s easy to spot and it can apply to both short-term and long-term trades.
At the same time, it’s hard to interpret a rising wedge without taking into account all current market conditions. Before making a decision, it’s important to consider the length of the trend and the context of its formation. Using other technical indicators and tools can help verify that an alleged rising wedge is indeed valid and really does predict a bearish reversal.
Finally, now that you’ve identified a rising wedge and seen the breakout, you can enter the trade. Don’t forget to plan your exit by setting a profit target for your positions. You can also place a stop-loss order to minimize the risks.